


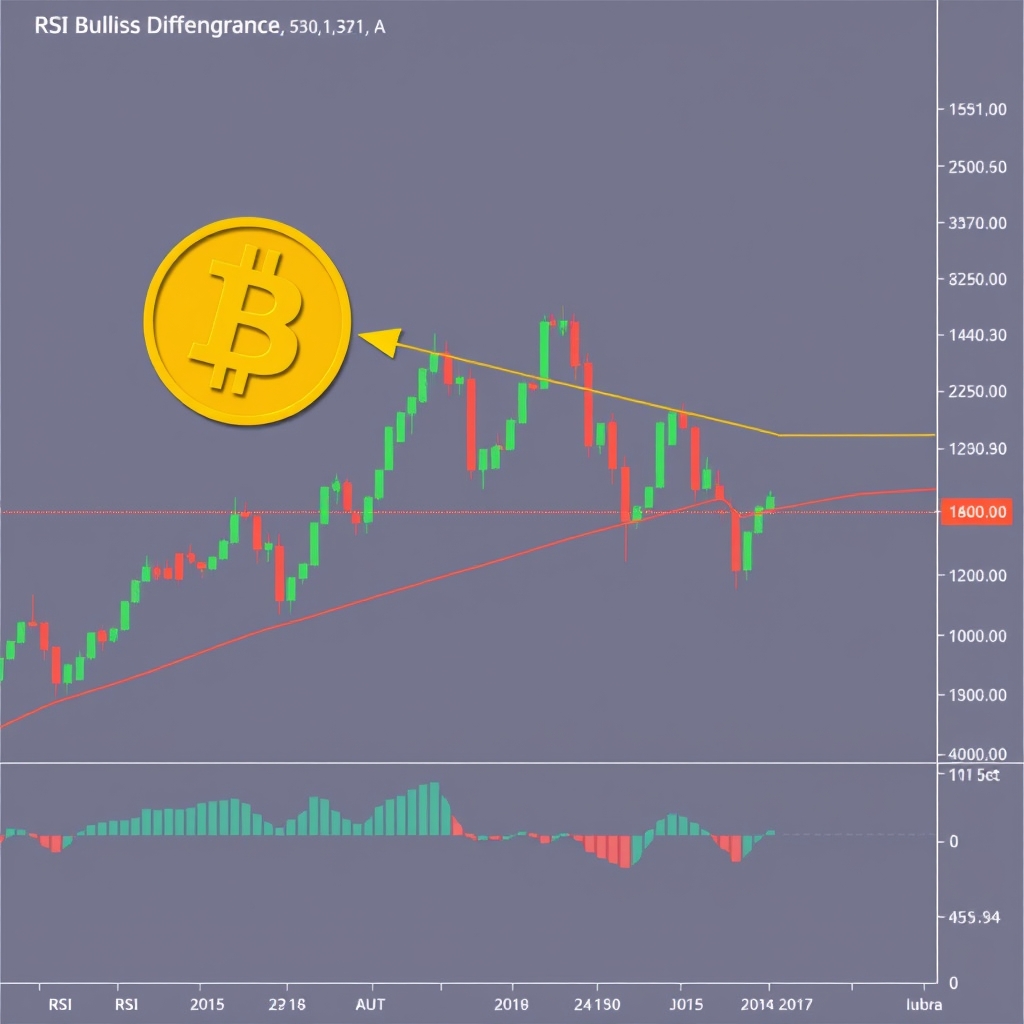
A bullish Bitcoin RSI divergence has reopened one of the market’s favorite debates: are we near a bear-market bottom, or is the low still ahead? Some analysts are drawing comparisons to the 2022 cycle trough, pointing to the same momentum signature that preceded that turn. Others caution that the setup can precede more downside before any durable recovery. For traders, the Bitcoin RSI divergence is worth understanding as a probability signal, not a promise.
What Happened
The Relative Strength Index (RSI) measures the speed and scale of recent price moves on a scale of 0 to 100. A bullish divergence forms when price prints a lower low but RSI prints a higher low, suggesting that selling momentum is fading even as price keeps slipping. That is the pattern several analysts have flagged on Bitcoin’s higher time frames.


The comparison being made is to 2022, when a similar divergence formed around the cycle’s eventual bottom. The argument is that momentum is quietly stabilizing beneath a weak price, a condition that has historically preceded major reversals. But the same commentators note the caveat plainly: divergence signaled exhaustion, it did not mark the exact low, and further downside came before the turn.
What It Means for Traders
An RSI divergence describes weakening momentum, not a guaranteed reversal. It flags that the current downtrend may be running out of energy, which raises the odds of a bounce or a base forming. It does not tell you the timing or the depth of any final low, and divergences can persist — or fail outright — while price grinds lower.
That is why experienced traders treat a signal like this as one input among many rather than a standalone trigger. Confirmation matters: a reclaim of a key level, a shift in volume, or a break of the near-term downtrend structure carries more weight than the indicator alone. Acting on a divergence without confirmation is how traders get caught in the “new lows still to come” scenario that the bears are warning about.
Risk framing is the practical response. Divergence-driven setups reward patience and defined invalidation over conviction, because the signal explicitly leaves room for further downside. Understanding what would prove the thesis wrong is as important as understanding what would confirm it.
The Bigger Picture
The bottom debate is playing out against a heavy macro backdrop. Bitcoin has been trading near the low $60,000s amid Federal Reserve uncertainty, ETF flow swings, and geopolitical shocks that have repeatedly jolted risk assets. Technical signals rarely operate in a vacuum, and the same divergence can resolve very differently depending on whether the macro tide is coming in or going out.
What makes this cycle distinct is the growing weight of institutional flows through spot ETFs and corporate treasuries. Those participants can blunt or amplify technical patterns by adding steady demand or sudden supply that older, retail-driven cycles lacked. A momentum signal that worked cleanly in 2022 sits inside a very different market structure today, which is part of why analysts disagree so sharply on what it means now.
Conclusion
Bitcoin’s bullish RSI divergence is a genuine signal that selling momentum is fading, and the 2022 echo is why it is getting attention. But the analysts flagging it are also flagging its limits: divergence marks exhaustion, not a confirmed bottom, and lower prices remain on the table. For traders, the useful posture is to weigh the signal, wait for confirmation, and respect that the low may or may not be in.
This article is informational only and does not constitute financial advice.