

The top digital asset, by market capitalization, Bitcoin, may be gearing up for a comeback. A bullish harami pattern offers hope of impending bullish momentum.
Bitcoin markets, on the 23rd of January 2022, look as though they may be staging a comeback or, at least, preparing to. The top-dog digital asset, by market capitalization, bled a further 12.49% after our last report but offers promise (bullish hope speaking here,) as the candles have formed a harami pattern since reaching a low of $34,000.

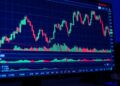
$BTC markets, in the past two days, have recovered about 7.35% since completing a 50.72% bearish run. The Bitcoin price – on the day – is at $35,273 (at time of writing) after establishing a current low of $34,603 and hitting resistance at the price level of $36,500.
Bitcoin markets still have the psychological resistance levels of $38k, and $40,6k to break beyond, before one can be confident of a true return to bullish form. $BTC has dropped below the 78% Fib level, which offers hope that the market may soon be in for some decent bullish momentum – though its next move still seems undecided.
Markets may, potentially, endure a further drop, or travel sideways, before a decisive move is made, as this is still the market’s third visit to the oversold position since it began its extended bearish haul. This gives us some indication that the bulls may soon drive the market into rebounding from its latest dive.
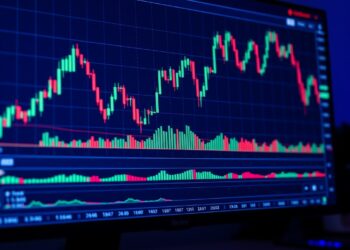
In our search for cofluence, we first turn to the Ichimoku Kinko Hyo, for some indication as to where markets may be headed next. The Ichimoku’s Tenkan line – though still traveling below Kijun – has turned slightly horizontal, while the Kijun line itself has also begun to curve into a horizontal line. The same can be said for the Senkou spans that make up Kumo. Senkou B is dropping to meet Senkou A, if their divergence thins, that could potentially spell the beginning of upward momentum. For now, things seem as though they may be headed sideways.
The MACD tells of a possible change in market momentum, as the MACD’s histogram looks to be running flat, while the fast line – while still below the slow line – has begun to curve. The Stochastic Oscillator seems to be speaking a similar dialect – to the MACD – as it currently sits in the oversold position, below the zero line. It hasn’t quite bottomed out yet, so the market may still go ranging.
One couldn’t blame the bears for being tired, as they’ve had quite an impressive run. Anyone who Shorted the market likely pulled together a tidy sum. It’s still unclear as to whether, or not, the bulls may take control, but it doesn’t seem as though the bears will give their reign over $BTC markets up without a fight.
Bears may still make a last stand, pulling Bitcoin prices below $30k. However, if the price has finally found a decent support level from which bulls can leap, $BTC may, soon, be set to may its.- long purported – run to the $100k level. By “soon” we mean, sometime this year – or the next – who can call it?


