

• About us
  • Advertise
  • FAQ
  • Login
  • Register
CoinFractal
Advertisement
  • Home
  • Bitcoin
  • Crypto
    • Ethereum
    • Litecoin
    • Binance Coin
    • Ripple
    • Stellar
    • ChainLink
    • EOS
    • DogeCoin
  • Markets
  • Guides
  • Tools
    • Alerts
    • Charts
    • Convert
    • Apps
    • Exchange
    • Ideas
  • About us
    • Write for us
    • Advertise
    • Subscription
  • Contact Us
No Result
View All Result
  • Home
  • Bitcoin
  • Crypto
    • Ethereum
    • Litecoin
    • Binance Coin
    • Ripple
    • Stellar
    • ChainLink
    • EOS
    • DogeCoin
  • Markets
  • Guides
  • Tools
    • Alerts
    • Charts
    • Convert
    • Apps
    • Exchange
    • Ideas
  • About us
    • Write for us
    • Advertise
    • Subscription
  • Contact Us
No Result
View All Result
CoinFractal
No Result
View All Result
Home Ethereum

Ethereum Daily RSI Divergence: What the Chart Is Showing Now

Michael Johnson by Michael Johnson
July 11, 2026
in Ethereum, Technical Analysis
Reading Time: 3 mins read
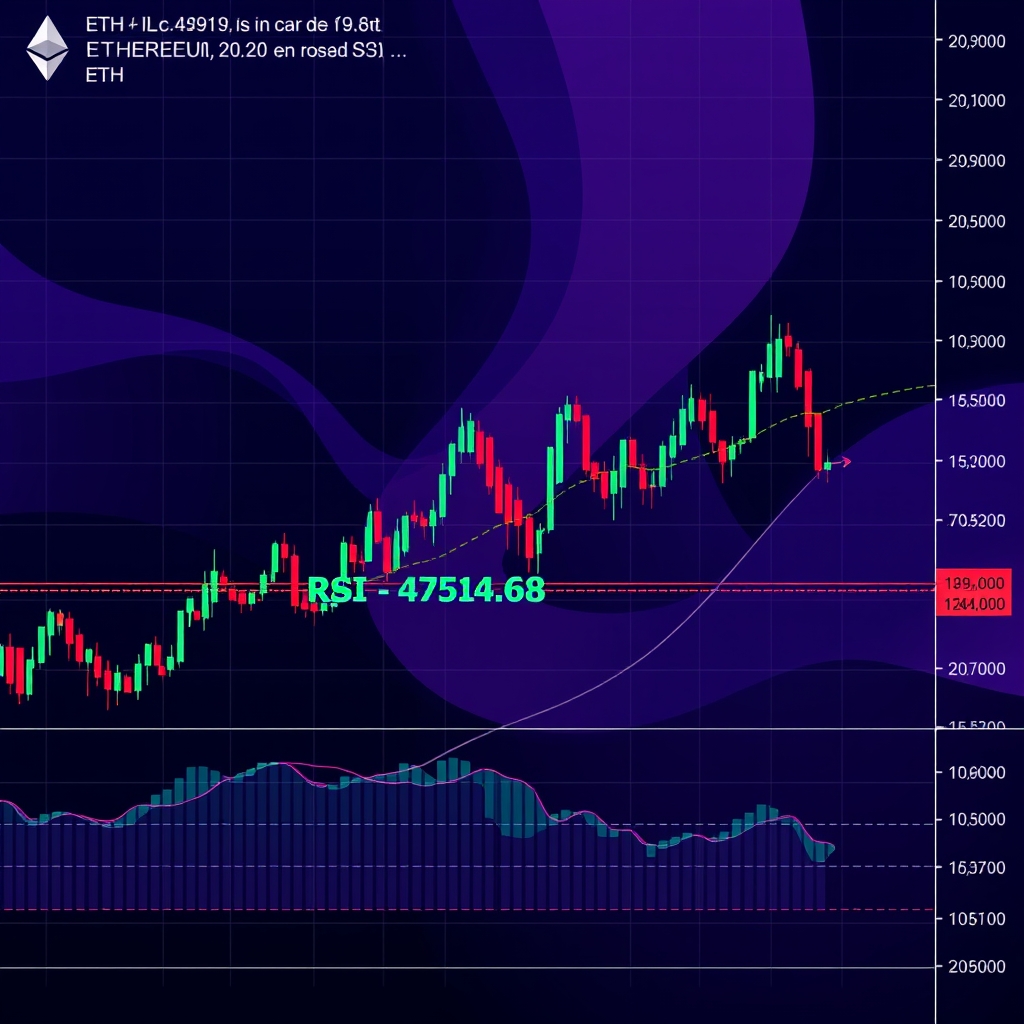
Ethereum price technical analysis chart with RSI indicator
189
SHARES
1.5k
VIEWS
Share on FacebookShare on Twitter

Ethereum has spent the better part of the recent higher-timeframe trend under clear seller control, with lower highs and lower lows defining the structure since the last major rejection from key resistance. That backdrop makes a new development on the daily chart worth watching closely: a bullish RSI divergence is forming, where price is printing lower lows while the Relative Strength Index is printing higher lows. Traders track this pattern specifically because it has historically preceded periods where downside momentum starts to fade, though it is not a signal that reverses a trend on its own.

What Happened

Ethereum’s higher-timeframe chart has been dominated by a persistent downtrend, and the most recent attempt to reclaim resistance was rejected, sending price back toward prior lows. On the daily timeframe, however, the Relative Strength Index, a momentum oscillator that measures the speed and magnitude of recent price moves on a scale of 0 to 100, has not confirmed that latest low. While ETH’s price action carved out a fresh low, the RSI reading at that low sits higher than the RSI reading at the previous low.


Related articles

Illustration of a Wall Street bank launching low-cost Ethereum and Solana exchange-traded funds

Morgan Stanley Files for Low-Cost ETH and SOL ETFs

July 10, 2026
Bitcoin price chart showing RSI bullish divergence in technical analysis

Bitcoin RSI Divergence Sparks a Bear-Market-Bottom Debate

July 10, 2026

This gap between price structure and momentum structure is what traders call a bullish divergence. In simple terms, even though sellers pushed price lower, they did so with noticeably less momentum behind the move than the prior leg down. That is the core observation currently visible on the chart, and it is the reason the setup is getting attention across trading desks and crypto chart rooms this week.

What It Means for Traders

A bullish RSI divergence like this does not mean a trend reversal is confirmed. It means the underlying momentum used to justify the current bearish move has weakened, which can indicate that sellers are losing conviction or that exhaustion is setting in near current levels. Traders generally treat this as an early warning sign to monitor rather than a trigger to act on.

What traders are actually watching now is behavior around nearby structure: whether ETH can hold above the most recent swing low, whether volume picks up on any bounce attempt, and whether the RSI itself breaks above its own prior swing high, which would add further weight to the divergence reading. Until price confirms with a structural shift, such as a higher low or a break of a short-term trendline, the divergence remains a momentum observation rather than a completed setup.

It is also worth noting that divergences can persist or even repeat during strong downtrends before any meaningful reaction occurs. Momentum can diverge from price for extended periods, and sellers can continue pushing the market lower even as RSI readings drift higher. That is why experienced chart readers treat this pattern as one input among several, not a standalone reason to change positioning.

The Bigger Picture

Zooming out, Ethereum’s higher-timeframe trend remains bearish until proven otherwise, and a single daily divergence does not erase that context on its own. What it does is add a data point that traders are folding into a broader read of the market, alongside resistance levels, volume trends, and how ETH behaves relative to Bitcoin and the wider crypto market during this stretch.

For readers following the setup, it can help to revisit how ETH has reacted at comparable resistance zones recently, since prior rejection points often inform how traders frame the current structure. Our coverage of heavy Ethereum whale selling near resistance adds useful context on the supply pressure shaping this chart.

The takeaway for now is straightforward: the chart shows a momentum divergence worth tracking, not a confirmed shift in trend. Whether this early signal develops into something more will depend on how price behaves at the levels traders are currently watching, and confirmation, if it comes, will show up in price structure itself rather than in the indicator alone.

This article is informational only and does not constitute financial advice.

Tags: $ETHcrypto marketsEthereumrsitechnical analysis
Share76Tweet47
Previous Post

Sustainable DeFi Yield vs. Token Incentives: A Trader’s Guide

Next Post

Bitcoin Cycle Timing: What the Four-Year Pattern Suggests

Michael Johnson

Michael Johnson

Michael is chief editor for Coinfractal.

Related Posts

Illustration of a Wall Street bank launching low-cost Ethereum and Solana exchange-traded funds

Morgan Stanley Files for Low-Cost ETH and SOL ETFs

by Michael Johnson
July 10, 2026
0

Morgan Stanley filed amendments positioning its Ethereum and Solana ETFs as among the cheapest in the sector — a fee...

Bitcoin price chart showing RSI bullish divergence in technical analysis

Bitcoin RSI Divergence Sparks a Bear-Market-Bottom Debate

by Michael Johnson
July 10, 2026
0

A bullish Bitcoin RSI divergence has some analysts drawing 2022-bottom comparisons, while others warn fresh lows could still come. Here's...

Ethereum Foundation-funded program exposes North Korean IT workers embedded in crypto teams

Ethereum Foundation-Funded Program Exposes 100 DPRK Crypto Workers

by Michael Johnson
July 9, 2026
0

A program funded by an Ethereum Foundation stipend flagged 100 North Korean IT workers and warned 53 projects, exposing a...

Ethereum whale on-chain selling near a resistance level with market chart

Ethereum Whale Selling Hits $900M as ETH Stalls at Resistance

by Michael Johnson
July 5, 2026
0

Ethereum whale selling has moved back into focus after on-chain data showed large holders, along with a portion of ETF-linked...

Corporate Ethereum treasury accumulating ETH

Sharplink Buys $62.4M in ETH as Ether Treasury Strategy Resumes

by Michael Johnson
July 2, 2026
0

Sharplink bought nearly 40,000 ETH last week after an eight-month pause. Here is what the renewed Ether treasury buying means...

Load More
Next Post
Bitcoin four-year market cycle and halving timeline chart

Bitcoin Cycle Timing: What the Four-Year Pattern Suggests

  • Trending
  • Comments
  • Latest
Disabled Apes Community Project to Mint NFT Collection To Support The Disabled

Disabled Apes Community Project to Mint NFT Collection To Support The Disabled

May 15, 2022

$COTI Token Looks Poised For Bullish Price Action,, Following Announcement of Upcoming COTI Pay, Physical Debit Cards

May 13, 2021

Coinbase Users Can Now Gamify Their Experience Through League of Traders Integration

June 25, 2021
Coinsfera Opens Crypto OTC Trading Desk In Dubai

Coinsfera Opens Crypto OTC Trading Desk In Dubai

May 15, 2022

PayPal Users Can Now Check Out With Crypto

0

Global Financial Regulators Now Eyeing Defi, Altering Guidance Wording To Accommodate NFT’s

0

Mercury FX, & Ripple Launch Remittances Pilot In South Africa, Also Inducted Into IFWG Sandbox

0

FTSE Russell’s Portfolio Allocation Strategy For Institutional Investors, Targeted At Mitigation Volatility Risk

0
Bitcoin four-year market cycle and halving timeline chart

Bitcoin Cycle Timing: What the Four-Year Pattern Suggests

July 11, 2026
Ethereum price technical analysis chart with RSI indicator

Ethereum Daily RSI Divergence: What the Chart Is Showing Now

July 11, 2026
Decentralized finance stablecoin yield dashboard concept

Sustainable DeFi Yield vs. Token Incentives: A Trader’s Guide

July 11, 2026
Bitcoin derivatives regulation and crypto leverage trading concept

CME Sues Kalshi Over Its Bitcoin Perpetual-Style Contract

July 11, 2026
coinfractal logo

CoinFractal is cryptocurrency trading news, insights, and market forecast platform.

Categories

  • Altcoins
  • Apps
  • Bitcoin
  • Blockchain
  • Business
  • CBDC
  • ChainLink
  • Crypto
  • Defi
  • DogeCoin
  • EOS
  • Ethereum
  • Ethereum
  • Events
  • Government
  • Guides
  • Ideas
  • Insights
  • Litecoin
  • Litecoin
  • Markets
  • Metaverse
  • Metaverse
  • Mining
  • News
  • NFT
  • Press Release
  • Ripple
  • Solana
  • Stellar
  • Technical Analysis

Tags

$BTC $DOGE $ETH Adoption Altcoin Altcoins Binance Bitcoin Blockchain Bullish Action CFTC China Crypto Cryptocurrency crypto regulation Crypto Users Defi Digital Assets Ethereum Etheruem Exchange Listing Exchanges Fintech Huobi Institutions Investment Kalshi Liquidity macro Market Analysis Market Crash Markets Market Stories Market Structure MiCA NFT Prediction Markets Price Action Price Analysis Regulation Research Stablecoin stablecoins Trading Volatility

Newsletter

The most important world news and events of the day

Be the first to know latest important news & events directly to your inbox.

By signing up, I agree to our TOS and Privacy Policy.

  • About us
  • FAQ
  • Contact Us
  • Cookie Policy
  • Privacy Policy
  • Terms and conditions
  • Disclaimer

© Copyright 2021, All Rights Reserved by CoinFractal. Made by Mobile & Web Development Company - Ingenium Web

Welcome Back!

Login to your account below

Forgotten Password? Sign Up

Create New Account!

Fill the forms below to register

All fields are required. Log In

Retrieve your password

Please enter your username or email address to reset your password.

Log In
bitcoin
Bitcoin (BTC) $ 64,308.00
ethereum
Ethereum (ETH) $ 1,825.75
tether
Tether (USDT) $ 0.999237
bnb
BNB (BNB) $ 580.52
usd-coin
USDC (USDC) $ 0.999808
xrp
XRP (XRP) $ 1.12
solana
Solana (SOL) $ 78.15
tron
TRON (TRX) $ 0.331033
figure-heloc
Figure Heloc (FIGR_HELOC) $ 1.03
staked-ether
Lido Staked Ether (STETH) $ 2,265.05
No Result
View All Result
  • Home
  • Bitcoin
  • Crypto
    • Ethereum
    • Litecoin
    • Binance Coin
    • Ripple
    • Stellar
    • ChainLink
    • EOS
    • DogeCoin
  • Markets
  • Guides
  • Tools
    • Alerts
    • Charts
    • Convert
    • Apps
    • Exchange
    • Ideas
  • About us
    • Write for us
    • Advertise
    • Subscription
  • Contact Us

© Copyright 2021, All Rights Reserved by BizzNerd. Made by Mobile & Web Development Company - Ingenium Web

This website uses cookies. By continuing to use this website you are giving consent to cookies being used. Visit our Privacy Policy.
Not enough quota to unlock this post
Unlock left : 0
Are you sure want to cancel subscription?